Wednesday, November 02, 2011
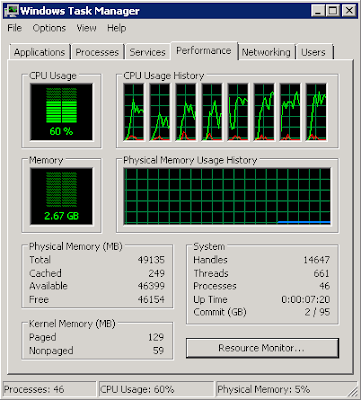
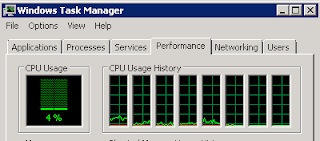
identify the cause of high cpu utilization via xperf
1. Install xperf. Now xperf is in windows SDK. The setup file is wpt_x64.exe for amd64.
2. Start tracing
xperf -on latency -stackwalk Profile
3. After a while, stop tracing and generate trace file trace.etl.
xperf -d trace.etl
4. analyze the result. You need to provide pdb file to show the function name.
xperf trace.etl
As you can see sal_usleep() is the culprit and takes most of CPU time.
After we fix sal_usleep(), the CPU utilization drops significantly.
Another powerful feature of xperf is stack walking. It will output call stacks of a function. More information can be find here (stack walking) and here (enable stack walking on x64).
Subscribe to:
Post Comments (Atom)


No comments:
Post a Comment