long time ago, I knew that certain system call will returned EINTR during block. But I did not know why, so forget to ask why. Until recently, I start to think about this problem, the answer turns out to be in a long time ago favorable book APUE.
"A characteristic of earlier UNIX systems is that if a process
caught a signal while the process was blocked in a "slow" system call, the
system call was interrupted. The system call returned an error and
errno was set to EINTR. This was done under the assumption
that since a signal occurred and the process caught it, there is a good chance
that something has happened that should wake up the blocked system call.
" --Section 10.5. Richard Stevens.
Monday, November 28, 2011
Thursday, November 17, 2011
openflow indigo artchitecture
Indigo is project to produce OpenFlow enabled hardware switch. Here is the software architecture of OpenFlow enabled hardware switch they posted on their website.
Here we can see several long running processes. But there is no details about the functionality of each process. Which serves for the openflow controller? Here is the missing information. As you can see, the ofprotocol and ofdatapath actually talk to the openflow controllers and monitors.
Wednesday, November 02, 2011
identify the cause of high cpu utilization via xperf
1. Install xperf. Now xperf is in windows SDK. The setup file is wpt_x64.exe for amd64.
2. Start tracing
xperf -on latency -stackwalk Profile
3. After a while, stop tracing and generate trace file trace.etl.
xperf -d trace.etl
4. analyze the result. You need to provide pdb file to show the function name.
xperf trace.etl
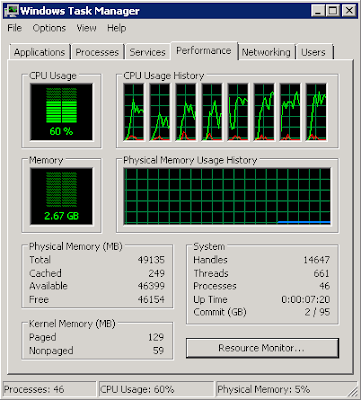
As you can see sal_usleep() is the culprit and takes most of CPU time.
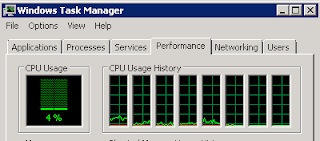
After we fix sal_usleep(), the CPU utilization drops significantly.
Another powerful feature of xperf is stack walking. It will output call stacks of a function. More information can be find here (stack walking) and here (enable stack walking on x64).
Subscribe to:
Comments (Atom)


